PYnative

Python Programming

  • Learn Python
  • Exercises
  • Quizzes
  • Code Editor
  • Tricks
Home » Python Exercises » Python Matplotlib Exercise

Python Matplotlib Exercise

Updated on: March 9, 2021 | 21 Comments

Python Matplotlib Exercise

This Matplotlib exercise project helps Python developers learn and practice data visualization using Matplotlib by solving multiple questions and problems.

Matplotlib is a Python 2D plotting library that produces high-quality charts and figures, which helps us visualize extensive data to understand better. Pandas is a handy and useful data-structure tool for analyzing large and complex data.

In this exercise, we are using Pandas and Matplotlib to visualize Company Sales Data.
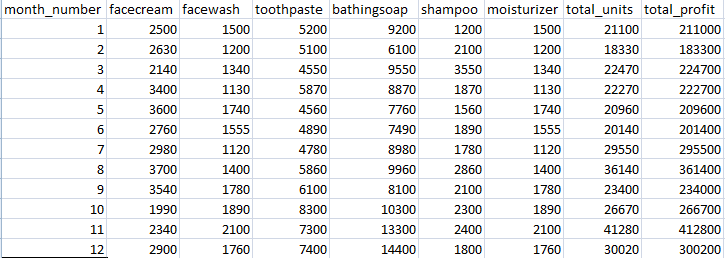
Matplotlib Exercise company sales data

Use the following CSV file for this exercise. Read this file using Pandas or NumPy or using in-built matplotlib function.

company_sales_dataDownload company sales dataset

What included in this Matplotlib Exercise?

This exercise contains ten questions. The solution is provided for each issue. Each question includes a specific Matplotlib topic you need to learn. When you complete each question, you get more familiar with Data data visualization using matplotlib.

Exercise 1: Read Total profit of all months and show it using a line plot

Total profit data provided for each month. Generated line plot must include the following properties: –

  • X label name = Month Number
  • Y label name = Total profit

The line plot graph should look like this.
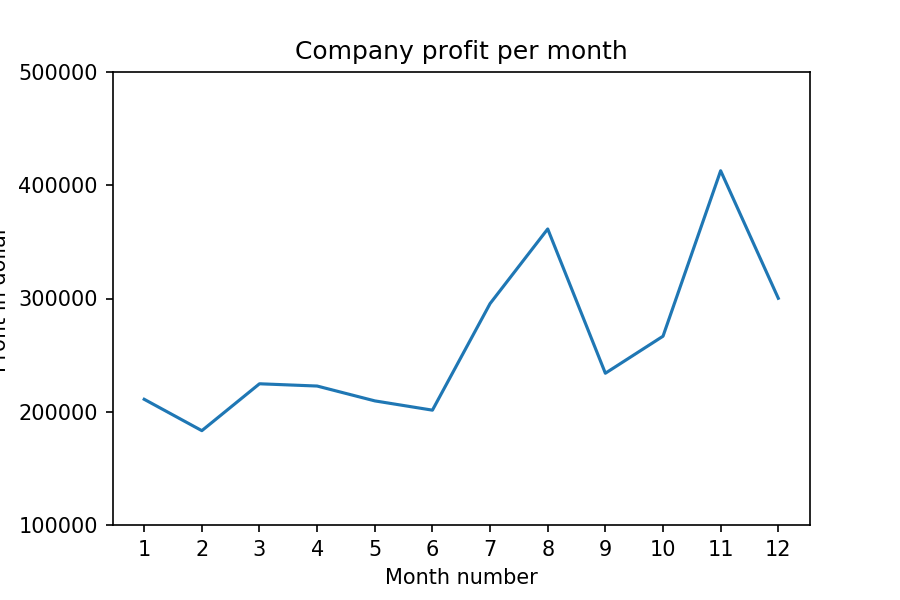
Matplotlib Exercise 1: Read Total profit of all months and show it using a line plot
Show Solution
import pandas as pd
import matplotlib.pyplot as plt  

df = pd.read_csv("D:\\Python\\Articles\\matplotlib\\sales_data.csv")
profitList = df ['total_profit'].tolist()
monthList  = df ['month_number'].tolist()
plt.plot(monthList, profitList, label = 'Month-wise Profit data of last year')
plt.xlabel('Month number')
plt.ylabel('Profit in dollar')
plt.xticks(monthList)
plt.title('Company profit per month')
plt.yticks([100000, 200000, 300000, 400000, 500000])
plt.show()

Exercise 2: Get total profit of all months and show line plot with the following Style properties

Generated line plot must include following Style properties: –

  • Line Style dotted and Line-color should be red
  • Show legend at the lower right location.
  • X label name = Month Number
  • Y label name = Sold units number
  • Add a circle marker.
  • Line marker color as read
  • Line width should be 3

The line plot graph should look like this.
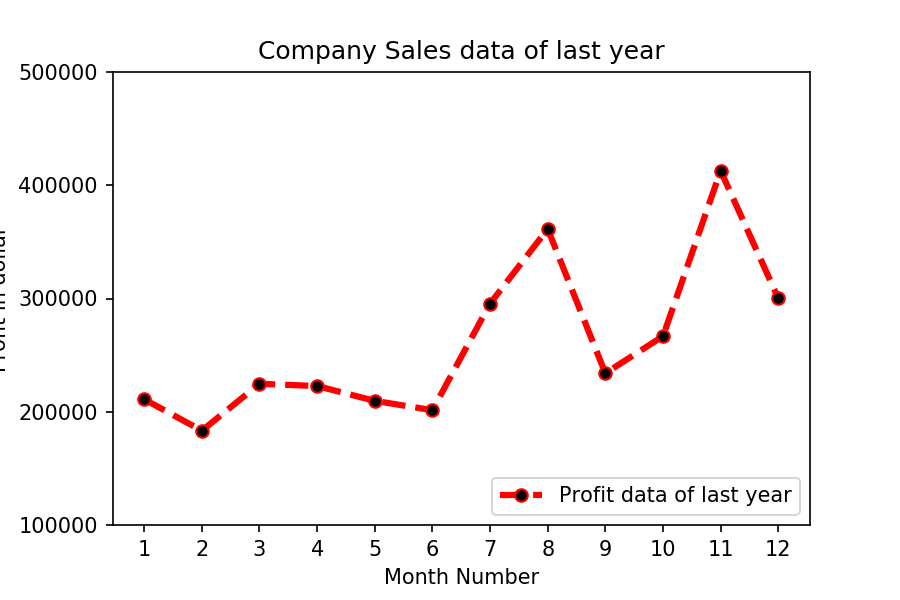
Matplotlib Exercise 2: Get Total profit of all months and show line plot with the following Style properties
Show Solution
import pandas as pd
import matplotlib.pyplot as plt  

df = pd.read_csv("D:\\Python\\Articles\\matplotlib\\sales_data.csv")
profitList = df ['total_profit'].tolist()
monthList  = df ['month_number'].tolist()

plt.plot(monthList, profitList, label = 'Profit data of last year', 
      color='r', marker='o', markerfacecolor='k', 
      linestyle='--', linewidth=3)
      
plt.xlabel('Month Number')
plt.ylabel('Profit in dollar')
plt.legend(loc='lower right')
plt.title('Company Sales data of last year')
plt.xticks(monthList)
plt.yticks([100000, 200000, 300000, 400000, 500000])
plt.show()

Exercise 3: Read all product sales data and show it  using a multiline plot

Display the number of units sold per month for each product using multiline plots. (i.e., Separate Plotline for each product ).

The graph should look like this.

Matplotlib Exercise 3: Read all product sales data and show it  using a multiline plot
Show Solution
import pandas as pd
import matplotlib.pyplot as plt  

df = pd.read_csv("D:\\Python\\Articles\\matplotlib\\sales_data.csv")
monthList  = df ['month_number'].tolist()
faceCremSalesData   = df ['facecream'].tolist()
faceWashSalesData   = df ['facewash'].tolist()
toothPasteSalesData = df ['toothpaste'].tolist()
bathingsoapSalesData   = df ['bathingsoap'].tolist()
shampooSalesData   = df ['shampoo'].tolist()
moisturizerSalesData = df ['moisturizer'].tolist()

plt.plot(monthList, faceCremSalesData,   label = 'Face cream Sales Data', marker='o', linewidth=3)
plt.plot(monthList, faceWashSalesData,   label = 'Face Wash Sales Data',  marker='o', linewidth=3)
plt.plot(monthList, toothPasteSalesData, label = 'ToothPaste Sales Data', marker='o', linewidth=3)
plt.plot(monthList, bathingsoapSalesData, label = 'ToothPaste Sales Data', marker='o', linewidth=3)
plt.plot(monthList, shampooSalesData, label = 'ToothPaste Sales Data', marker='o', linewidth=3)
plt.plot(monthList, moisturizerSalesData, label = 'ToothPaste Sales Data', marker='o', linewidth=3)

plt.xlabel('Month Number')
plt.ylabel('Sales units in number')
plt.legend(loc='upper left')
plt.xticks(monthList)
plt.yticks([1000, 2000, 4000, 6000, 8000, 10000, 12000, 15000, 18000])
plt.title('Sales data')
plt.show()

Exercise 4: Read toothpaste sales data of each month and show it using a scatter plot

Also, add a grid in the plot. gridline style should “–“.

The scatter plot should look like this.
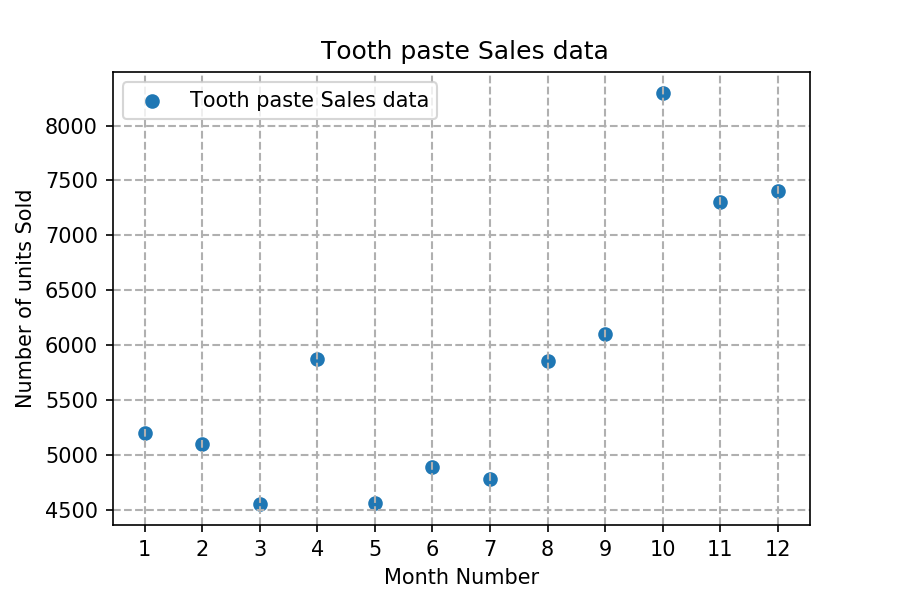
Matplotlib Exercise 4: Read toothpaste sales data of each month and show it using a scatter plot
Show Solution
import pandas as pd
import matplotlib.pyplot as plt  

df = pd.read_csv("D:\\Python\\Articles\\matplotlib\\sales_data.csv")
monthList  = df ['month_number'].tolist()
toothPasteSalesData = df ['toothpaste'].tolist()
plt.scatter(monthList, toothPasteSalesData, label = 'Tooth paste Sales data')
plt.xlabel('Month Number')
plt.ylabel('Number of units Sold')
plt.legend(loc='upper left')
plt.title(' Tooth paste Sales data')
plt.xticks(monthList)
plt.grid(True, linewidth= 1, linestyle="--")
plt.show()

Exercise 5: Read face cream and facewash product sales data and show it using the bar chart

The bar chart should display the number of units sold per month for each product. Add a separate bar for each product in the same chart.

The bar chart should look like this.
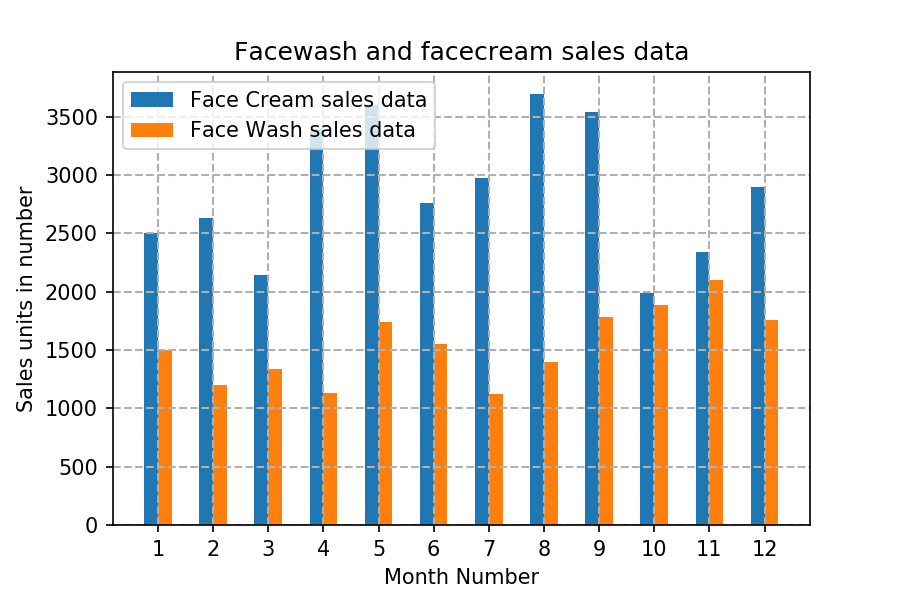
Matplotlib Exercise 5: Read face cream and facewash product sales data and show it using the bar chart
Show Solution
import pandas as pd
import matplotlib.pyplot as plt  

df = pd.read_csv("D:\\Python\\Articles\\matplotlib\\sales_data.csv")
monthList  = df ['month_number'].tolist()
faceCremSalesData   = df ['facecream'].tolist()
faceWashSalesData   = df ['facewash'].tolist()

plt.bar([a-0.25 for a in monthList], faceCremSalesData, width= 0.25, label = 'Face Cream sales data', align='edge')
plt.bar([a+0.25 for a in monthList], faceWashSalesData, width= -0.25, label = 'Face Wash sales data', align='edge')
plt.xlabel('Month Number')
plt.ylabel('Sales units in number')
plt.legend(loc='upper left')
plt.title(' Sales data')

plt.xticks(monthList)
plt.grid(True, linewidth= 1, linestyle="--")
plt.title('Facewash and facecream sales data')
plt.show()

Exercise 6: Read sales data of bathing soap of all months and show it using a bar chart. Save this plot to your hard disk

The bar chart should look like this.
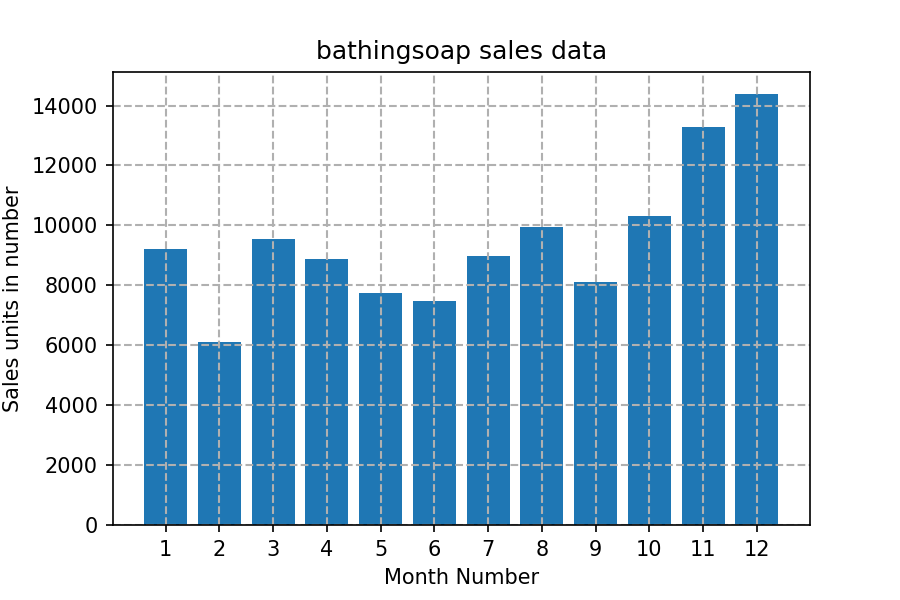
Matplotlib Exercise 6: Read sales data of bathing soap of all months and show it using a bar chart. Save this plot to your hard disk
Show Solution
import pandas as pd
import matplotlib.pyplot as plt  

df = pd.read_csv("D:\\Python\\Articles\\matplotlib\\sales_data.csv")
monthList  = df ['month_number'].tolist()
bathingsoapSalesData   = df ['bathingsoap'].tolist()
plt.bar(monthList, bathingsoapSalesData)
plt.xlabel('Month Number')
plt.ylabel('Sales units in number')
plt.title(' Sales data')
plt.xticks(monthList)
plt.grid(True, linewidth= 1, linestyle="--")
plt.title('bathingsoap sales data')
plt.savefig('D:\Python\Articles\matplotlib\sales_data_of_bathingsoap.png', dpi=150)
plt.show()

Exercise 7: Read the total profit of each month and show it using the histogram to see the most common profit ranges

The histogram should look like this.
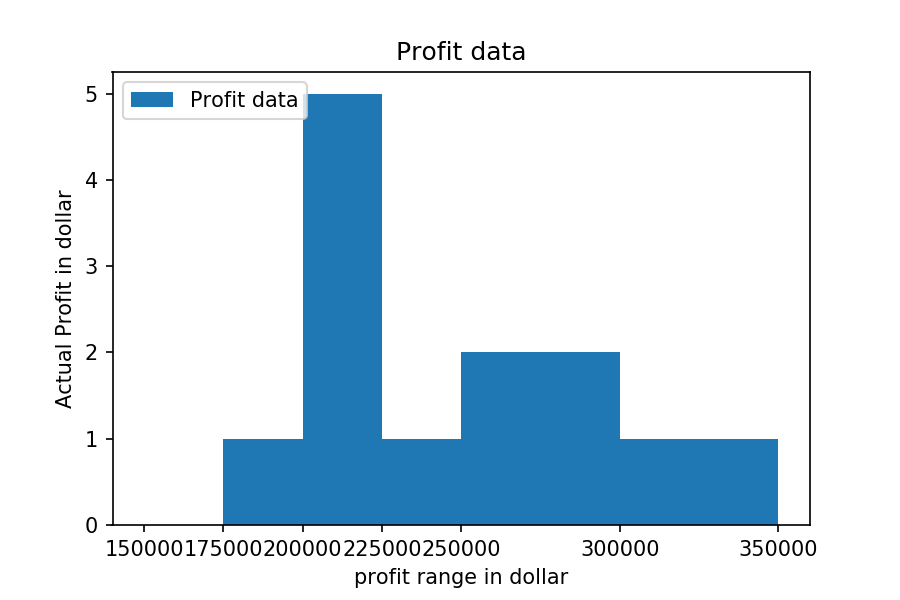
Matplotlib Exercise 7: Read the total profit of each month and show it using the histogram to see most common profit ranges
Show Solution
import pandas as pd
import matplotlib.pyplot as plt  

df = pd.read_csv("D:\\Python\\Articles\\matplotlib\\sales_data.csv")
profitList = df ['total_profit'].tolist()
labels = ['low', 'average', 'Good', 'Best']
profit_range = [150000, 175000, 200000, 225000, 250000, 300000, 350000]
plt.hist(profitList, profit_range, label = 'Profit data')
plt.xlabel('profit range in dollar')
plt.ylabel('Actual Profit in dollar')
plt.legend(loc='upper left')
plt.xticks(profit_range)
plt.title('Profit data')
plt.show()

Exercise 8: Calculate total sale data for last year for each product and show it using a Pie chart

Note: In Pie chart display Number of units sold per year for each product in percentage.

The Pie chart should look like this.
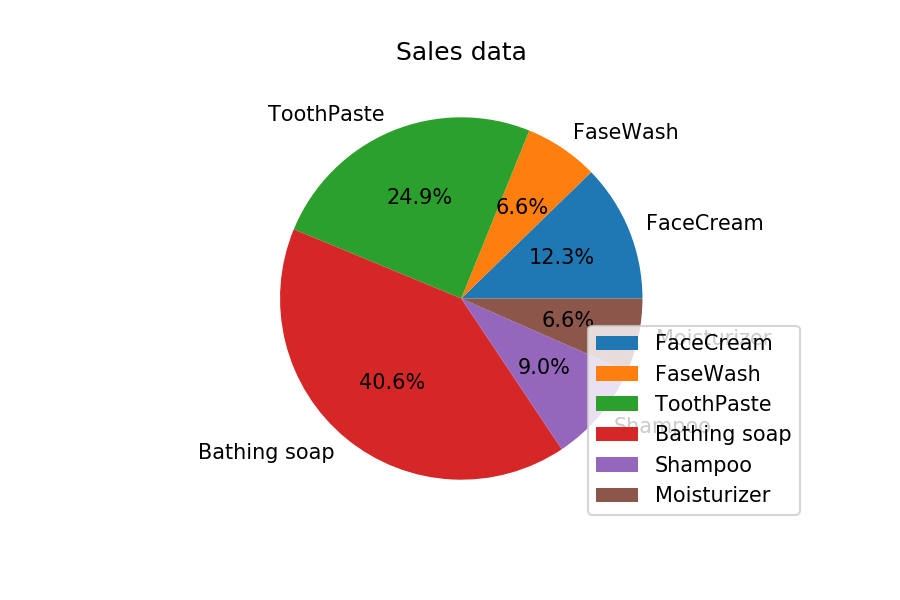
Matplotlib Exercise 8: Calculate total sale data for last year for each product and show it using a Pie chart
Show Solution
import pandas as pd
import matplotlib.pyplot as plt  

df = pd.read_csv("D:\\Python\\Articles\\matplotlib\\sales_data.csv")
monthList  = df ['month_number'].tolist()

labels = ['FaceCream', 'FaseWash', 'ToothPaste', 'Bathing soap', 'Shampoo', 'Moisturizer']
salesData   = [df ['facecream'].sum(), df ['facewash'].sum(), df ['toothpaste'].sum(), 
         df ['bathingsoap'].sum(), df ['shampoo'].sum(), df ['moisturizer'].sum()]
plt.axis("equal")
plt.pie(salesData, labels=labels, autopct='%1.1f%%')
plt.legend(loc='lower right')
plt.title('Sales data')
plt.show()

Exercise 9: Read Bathing soap facewash of all months and display it using the Subplot

The Subplot should look like this.
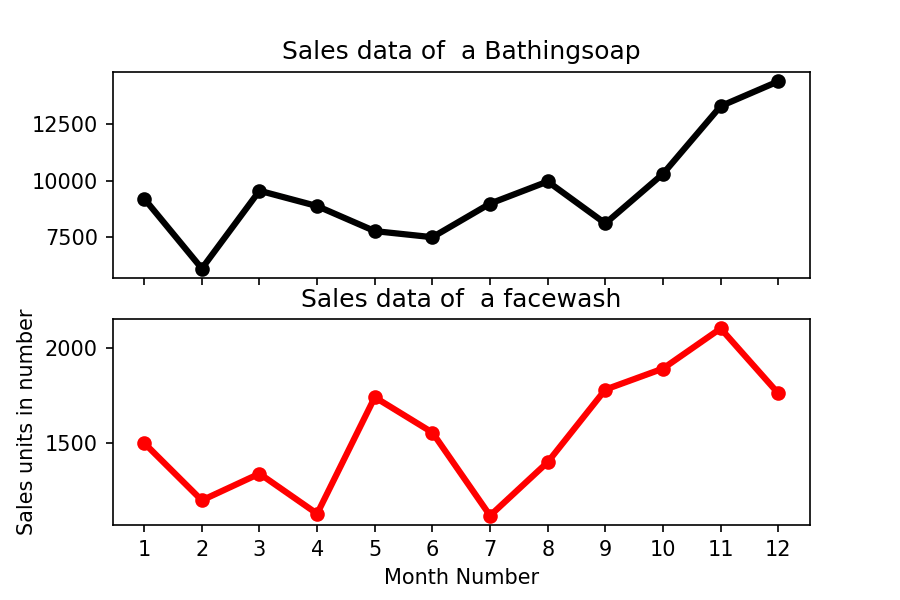
Matplotlib Exercise 9: Read Bathing soap facewash of all months and display it using the Subplot
Show Solution
import pandas as pd
import matplotlib.pyplot as plt  

df = pd.read_csv("D:\\Python\\Articles\\matplotlib\\sales_data.csv")
monthList  = df ['month_number'].tolist()
bathingsoap   = df ['bathingsoap'].tolist()
faceWashSalesData   = df ['facewash'].tolist()

f, axarr = plt.subplots(2, sharex=True)
axarr[0].plot(monthList, bathingsoap, label = 'Bathingsoap Sales Data', color='k', marker='o', linewidth=3)
axarr[0].set_title('Sales data of  a Bathingsoap')
axarr[1].plot(monthList, faceWashSalesData, label = 'Face Wash Sales Data', color='r', marker='o', linewidth=3)
axarr[1].set_title('Sales data of  a facewash')

plt.xticks(monthList)
plt.xlabel('Month Number')
plt.ylabel('Sales units in number')
plt.show()

Exercise Question 10: Read all product sales data and show it using the stack plot

The Stack plot should look like this.
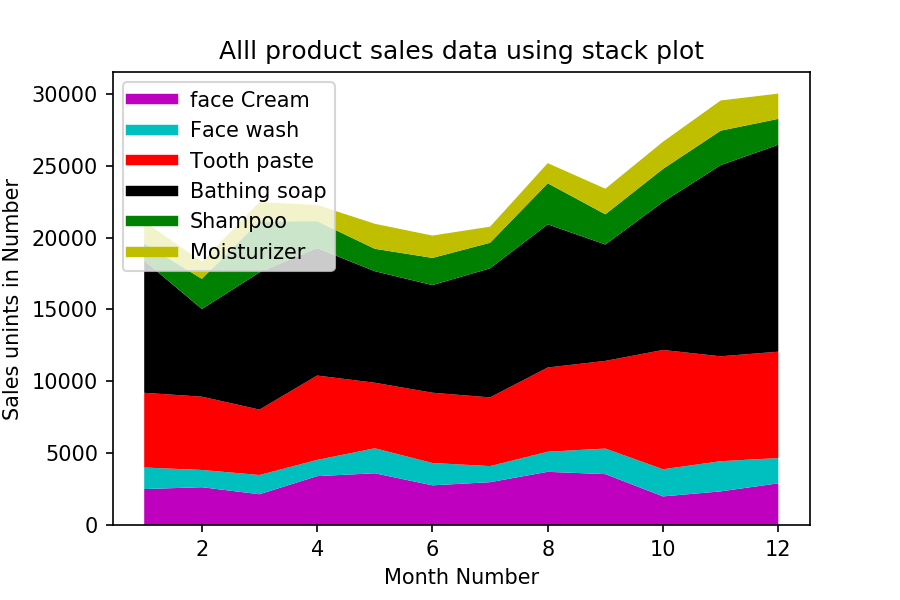
Matplotlib Exercise 10: Read all product sales data and show it using the stack plot
Show Solution
import pandas as pd
import matplotlib.pyplot as plt  

df = pd.read_csv("D:\\Python\\Articles\\matplotlib\\sales_data.csv")
monthList  = df ['month_number'].tolist()

faceCremSalesData   = df ['facecream'].tolist()
faceWashSalesData   = df ['facewash'].tolist()
toothPasteSalesData = df ['toothpaste'].tolist()
bathingsoapSalesData   = df ['bathingsoap'].tolist()
shampooSalesData   = df ['shampoo'].tolist()
moisturizerSalesData = df ['moisturizer'].tolist()

plt.plot([],[],color='m', label='face Cream', linewidth=5)
plt.plot([],[],color='c', label='Face wash', linewidth=5)
plt.plot([],[],color='r', label='Tooth paste', linewidth=5)
plt.plot([],[],color='k', label='Bathing soap', linewidth=5)
plt.plot([],[],color='g', label='Shampoo', linewidth=5)
plt.plot([],[],color='y', label='Moisturizer', linewidth=5)

plt.stackplot(monthList, faceCremSalesData, faceWashSalesData, toothPasteSalesData, 
              bathingsoapSalesData, shampooSalesData, moisturizerSalesData, 
              colors=['m','c','r','k','g','y'])

plt.xlabel('Month Number')
plt.ylabel('Sales unints in Number')
plt.title('Alll product sales data using stack plot')
plt.legend(loc='upper left')
plt.show()

Filed Under: Python, Python Exercises

Did you find this page helpful? Let others know about it. Sharing helps me continue to create free Python resources.

TweetF  sharein  shareP  Pin

About Vishal

Founder of PYnative.com I am a Python developer and I love to write articles to help developers. Follow me on Twitter. All the best for your future Python endeavors!

Related Tutorial Topics:

Python Python Exercises

Python Exercises and Quizzes

Free coding exercises and quizzes cover Python basics, data structure, data analytics, and more.

  • 15+ Topic-specific Exercises and Quizzes
  • Each Exercise contains 10 questions
  • Each Quiz contains 12-15 MCQ
Exercises
Quizzes

Posted In

Python Python Exercises
TweetF  sharein  shareP  Pin

 Python Exercises

  • Python Exercises Home
  • Basic Exercise for Beginners
  • Input and Output Exercise
  • Loop Exercise
  • Functions Exercise
  • String Exercise
  • Data Structure Exercise
  • List Exercise
  • Dictionary Exercise
  • Set Exercise
  • Tuple Exercise
  • Date and Time Exercise
  • OOP Exercise
  • Python JSON Exercise
  • Random Data Generation Exercise
  • NumPy Exercise
  • Pandas Exercise
  • Matplotlib Exercise
  • Python Database Exercise

All Python Topics

Python Basics Python Exercises Python Quizzes Python File Handling Python OOP Python Date and Time Python Random Python Regex Python Pandas Python Databases Python MySQL Python PostgreSQL Python SQLite Python JSON

About PYnative

PYnative.com is for Python lovers. Here, You can get Tutorials, Exercises, and Quizzes to practice and improve your Python skills.

Explore Python

  • Learn Python
  • Python Basics
  • Python Databases
  • Python Exercises
  • Python Quizzes
  • Online Python Code Editor
  • Python Tricks

Follow Us

To get New Python Tutorials, Exercises, and Quizzes

  • Twitter
  • Facebook
  • Sitemap

Legal Stuff

  • About Us
  • Contact Us

We use cookies to improve your experience. While using PYnative, you agree to have read and accepted our Terms Of Use, Cookie Policy, and Privacy Policy.

Copyright © 2018–2022 pynative.com