In this lesson, you will learn pandas DataFrame. It covers the basics of DataFrame, its attributes, functions, and how to use DataFrame for Data Analysis.
DataFrame is the most widely used data structure in Python pandas. You can imagine it as a table in a database or a spreadsheet.
Imagine you have an automobile showroom, and you want to analyze cars’ data to make business strategies. For example, you need to check how many vehicles you have in your showroom of type sedan, or the cars that give good mileage. For such analysis pandas DataFrame is used.
Table of contents
What is DataFrame in Pandas
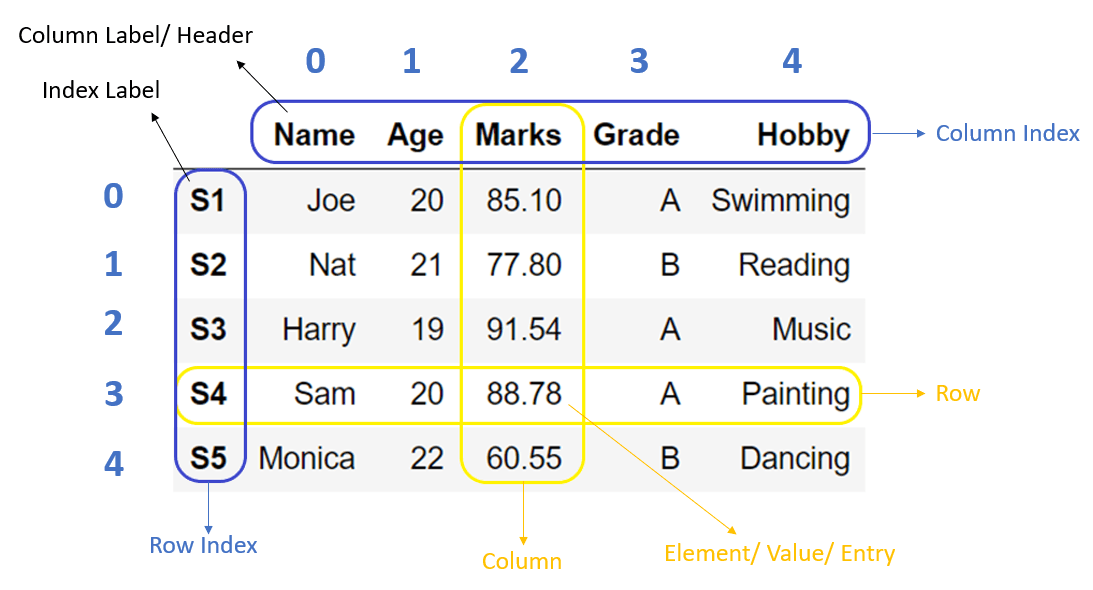
Dataframe is a tabular(rows, columns) representation of data. It is a two-dimensional data structure with potentially heterogeneous data.
Dataframe is a size-mutable structure that means data can be added or deleted from it, unlike data series, which does not allow operations that change its size.
DataFrame creation
Data is available in various forms and types like CSV, SQL table, JSON, or Python structures like list, dict etc. We need to convert all such different data formats into a DataFrame so that we can use pandas libraries to analyze such data efficiently.
To create DataFrame, we can use either the DataFrame constructor or pandas’ built-in functions. Below are some examples.
DataFrame constructor
pandas.DataFrame(data=None, index=None, columns=None, dtype=None, copy=False)Code language: Python (python)Parameters:
data: It takes inputdict,list,set,ndarray,Iterable, or DataFrame. If the input is not provided, then it creates an empty DataFrame. The resultant column order follows the insertion order.index: (Optional) It takes the list of row index for the DataFrame. The default value is a range of integers 0, 1,…n.columns: (Optional) It takes the list of columns for the DataFrame. The default value is a range of integers 0, 1,…n.dtype: (Optional) By default, It infers the data type from the data, but this option applies any specific data type to the whole DataFrame.copy: (Optional) Copy data from inputs. Boolean, Default False. Only affects DataFrame or 2d array-like inputs
Refer the following articles for more details:
Dataframe from dict
When we have data in dict or any default data structures in Python, we can convert it into DataFrame using the DataFrame constructor.
To construct a DataFrame from a dict object, we can pass it to the DataFrame constructor pd.DataFrame(dict). It creates DataFrame using, where dict keys will be column labels, and dict values will be the columns’ data. We can also use DataFrame.from_dict() function to Create DataFrame from dict.
Example
Dictionary
student_dict = {'Name':['Joe','Nat'], 'Age':[20,21], 'Marks':[85.10, 77.80]}Code language: Python (python)‘Name‘, ‘Age‘ and ‘Marks‘ are the keys in the dict when you convert they will become the column labels of the DataFrame.
Output
{'Name': ['Joe', 'Nat'], 'Age': [20, 21], 'Marks': [85.1, 77.8]}

  Name  Age  Marks
0  Joe   20   85.1
1  Nat   21   77.8
Dataframe from CSV
In the field of Data Science, CSV files are used to store large datasets. To efficiently analyze such datasets, we need to convert them into pandas DataFrame.
To create a DataFrame from CSV, we use the read_csv('file_name') function that takes the file name as input and returns DataFrame as output.
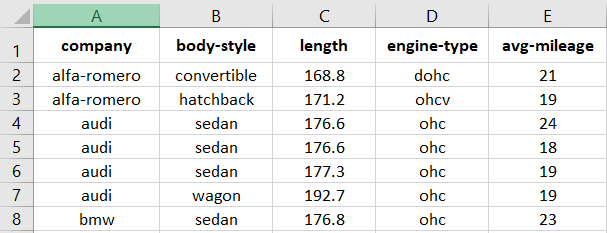
Let’s see how to read the Automobile_data.csv file into the DataFrame.
Output
        company   body-style  length engine-type  avg-mileage
0   alfa-romero  convertible   168.8        dohc           21
1   alfa-romero    hatchback   171.2        ohcv           19
2          audi        sedan   176.6         ohc           24
..          ...          ...     ...         ...          ...
58        volvo        sedan   188.8         ohc           23
59        volvo        wagon   188.8         ohc           23
DataFrame Options
When DataFrame is vast, and we can not display the whole data while printing. In that case, we need to change how DataFrame gets display on the console using the print function. For that, pandas have provided many options and functions to customize the presentation of the DataFrame.
To customize the display of DataFrame while printing
When we display the DataFrame using print() function by default, it displays 10 rows (top 5 and bottom 5). Sometimes we may need to show more or lesser rows than the default view of the DataFrame.
We can change the setting by using pd.options or pd.set_option() functions. Both can be used interchangeably.
The below example will show a maximum of 20 and a minimum of 5 rows while printing DataFrame.
Output
        company   body-style  length engine-type  avg-mileage
0   alfa-romero  convertible   168.8        dohc           21
1   alfa-romero    hatchback   171.2        ohcv           19
..          ...          ...     ...         ...          ...
58        volvo        sedan   188.8         ohc           23
59        volvo        wagon   188.8         ohc           23

[60 rows x 5 columns]
DataFrame metadata
Sometimes we need to get metadata of the DataFrame and not the content inside it. Such metadata information is useful to understand the DataFrame as it gives more details about the DataFrame that we need to process.
In this section, we cover the functions which provide such information of the DataFrame.
Let’s take an example of student DataFrame which contains ‘Name‘, ‘Age‘ and ‘Marks‘ of students as shown below.
Metadata info of DataFrame
DataFrame.info() is a function of DataFrame that gives metadata of DataFrame. Which includes,
- Number of rows and its range of index
- Total number of columns
- List of columns
- Count of the total number of non-null values in the column
- Data type of column
- Count of columns in each data type
- Memory usage by the DataFrame
Example
In the below example, we got metadata information of student DataFrame.
Output
<class 'pandas.core.frame.DataFrame'> RangeIndex: 3 entries, 0 to 2 Data columns (total 3 columns): # Column Non-Null Count Dtype --- ------ -------------- ----- 0 Name 3 non-null object 1 Age 3 non-null int64 2 Marks 3 non-null float64 dtypes: float64(1), int64(1), object(1) memory usage: 200.0+ bytes
Get the statistics of DataFrame
DataFrame.describe() is a function that gives mathematical statistics of the data in DataFrame. But, it applies to the columns that contain numeric values.
In our example of student DataFrame, it gives descriptive statistics of “Age” and “Marks” columns only, that includes:
- count: Total number of non-null values in the column
- mean: an average of numbers
- std: a standard deviation value
- min: minimum value
- 25%: 25th percentile
- 50%: 50th percentile
- 75%: 75th percentile
- max: maximum value
Note: Output of DataFrame.describe() function varies depending on the input DataFrame.
Example
Output
Age Marks count 3.0 3.000000 mean 20.0 84.813333 std 1.0 6.874484 min 19.0 77.800000 25% 19.5 81.450000 50% 20.0 85.100000 75% 20.5 88.320000 max 21.0 91.540000
DataFrame Attributes
DataFrame has provided many built-in attributes. Attributes do not modify the underlying data, unlike functions, but it is used to get more details about the DataFrame.
Following are majorly used attributes of the DataFrame.
| Attribute | Description |
|---|---|
DataFrame.index | It gives the Range of the row index |
DataFrame.columns | It gives a list of column labels |
DataFrame.dtypes | It gives column names and their data type |
DataFrame.values | It gives all the rows in DataFrame |
DataFrame.empty | It is used to check if the DataFrame is empty |
DataFrame.size | It gives a total number of values in DataFrame |
DataFrame.shape | It a number of rows and columns in DataFrame |
Example
Output
DataFrame :
    Name  Age  Marks
0    Joe   20  85.10
1    Nat   21  77.80
2  Harry   19  91.54
DataFrame Index : RangeIndex(start=0, stop=3, step=1)
DataFrame Columns : Index(['Name', 'Age', 'Marks'], dtype='object')
DataFrame Column types :
Name object
Age int64
Marks float64
dtype: object
DataFrame is empty? : False
DataFrame Shape : (3, 3)
DataFrame Size : 9
DataFrame Values :
[['Joe' 20 85.1]
['Nat' 21 77.8]
['Harry' 19 91.54]]
DataFrame selection
While dealing with the vast data in DataFrame, a data analyst always needs to select a particular row or column for the analysis. In such cases, functions that can choose a set of rows or columns like top rows, bottom rows, or data within an index range play a significant role.
Following are the functions that help in selecting the subset of the DataFrame.
| Function | Description |
|---|---|
DataFrame.head(n) | It is used to select top ‘n’ rows in DataFrame. |
DataFrame.tail(n) | It is used to select bottom ‘n’ rows in DataFrame. |
DataFrame.at | It is used to get and set the particular value of DataFrame using row and column labels. |
DataFrame.iat | It is used to get and set the particular value of DataFrame using row and column index positions. |
DataFrame.get(key) | It is used to get the value of a key in DataFrame where Key is the column name. |
DataFrame.loc() | It is used to select a group of data based on the row and column labels. It is used for slicing and filtering of the DataFrame. |
DataFrame.iloc() | It is used to select a group of data based on the row and column index position. Use it for slicing and filtering the DataFrame. |
Example
Output:
DataFrame :
     Name  Age  Marks
0    Joe   20  85.10
1    Nat   21  77.80
2  Harry   19  91.54

Top 2 rows using head() :
   Name  Age  Marks
0  Joe   20   85.1
1  Nat   21   77.8

Bottom 2 rows using tail() :
     Name  Age  Marks
1    Nat   21  77.80
2  Harry   19  91.54

Value at row index 0 and column 'Name' using at :  Joe

Value at first row and first column using iat :  Joe

Value of 'Name' column using get :
0      Joe
1      Nat
2    Harry
Name: Name, dtype: object

Value from row index 0 to 2 and 'Name' column using loc :
     Name
0    Joe
1    Nat
2  Harry

Value from row index 0 to 2(Exclusive) and column position 0 to 2(Exclusive) using iloc :
   Name  Age
0  Joe   20
1  Nat   21
DataFrame modification
DataFrame is similar to any excel sheet or a database table where we need to insert new data or drop columns and rows if not required. Such data manipulation operations are very common on a DataFrame.
In this section, we discuss the data manipulation functions of the DataFrame.
Insert columns
Sometimes it is required to add a new column in the DataFrame. DataFrame.insert() function is used to insert a new column in DataFrame at the specified position.
In the below example, we insert a new column “Class” as a third new column in the DataFrame with default value ‘A’ using the syntax:
df.insert(loc = col_position, column = new_col_name, value = default_value)Code language: Python (python)Example:
Output
Before adding new column:
    Name  Age  Marks
0    Joe   20  85.10
1    Nat   21  77.80
2  Harry   19  91.54

After adding new column:
    Name  Age Class  Marks
0    Joe   20     A  85.10
1    Nat   21     A  77.80
2  Harry   19     A  91.54
Drop columns
DataFrame may contain redundant data, in such cases, we may need to delete such data that is not required. DataFrame.drop() function is used to delete the columns from DataFrame.
Refer to the following articles to get more details
Example
In the below example, we delete the “Age” column from the student DataFrame using df.drop(columns=[col1,col2...]).
Output
Before dropping the column:
    Name  Age  Marks
0    Joe   20  85.10
1    Nat   21  77.80
2  Harry   19  91.54

After dropping the column:
    Name  Marks
0    Joe  85.10
1    Nat  77.80
2  Harry  91.54
Apply condition
We may need to update the value in the DataFrame based on some condition. DataFrame.where() function is used to replace the value of DataFrame, where the condition is False.
where(filter, other=new_value)Code language: Python (python)It applies the filter condition on all the rows in the DataFrame, as follows:
- If the filter condition returns False, then it updates the row with the value specified in
otherparameter. - If the filter condition returns True, then it does not update the row.
Example
In the below example, we want to replace the student marks with ‘0’ where marks are less than 80. We pass a filter condition df['Marks'] > 80 to the function.
Output
Before update:
    Name  Age  Marks
0    Joe   20  85.10
1    Nat   21  77.80
2  Harry   19  91.54

After update:
    Name  Age  Marks
0    Joe   20  85.10
1    Nat   21   0.00
2  Harry   19  91.54
DataFrame filter columns
Datasets contain massive data that need to be analyzed. But, sometimes, we may want to analyze relevant data and filter out all the other data. In such a case, we can use DataFrame.filter() function to fetch only required data from DataFrame.
It returns the subset of the DataFrame by applying conditions on each row index or column label as specified using the below syntax.
df.filter(like = filter_cond, axis = 'columns' or 'index')Code language: Python (python)It applies the condition on each row index or column label.
- If the condition passed then, it includes that row or column in the resultant DataFrame.
- If the condition failed, then it does not have that row or column in the resulting DataFrame.
Note: It applies the filter on row index or column label, not on actual data.
Example
In the below example, we only include the column with a column label that starts with ‘N’.
Output
Before applying filter:
    Name  Age  Marks
0    Joe   20  85.10
1    Nat   21  77.80
2  Harry   19  91.54

After applying filter:
    Name
0    Joe
1    Nat
2  Harry
DataFrame rename columns
While working with DataFrame, we may need to rename the column or row index. We can use DataFrame.rename() function to alter the row or column labels.
We need to pass a dictionary of key-value pairs as input to the function. Where key of the dict is the existing column label, and the value of dict is the new column label.
df.rename(columns = {'old':'new'})Code language: Python (python)It can be used to rename single or multiple columns and row labels.
Example
In the below example, we rename column ‘Marks‘ to ‘Percentage‘ in the student DataFrame.
Output
Before rename:
    Name  Age  Marks
0    Joe   20  85.10
1    Nat   21  77.80
2  Harry   19  91.54

After rename:
    Name  Age  Percentage
0    Joe   20       85.10
1    Nat   21       77.80
2  Harry   19       91.54
DataFrame Join
In most of the use cases of Data Analytics, data gathered from multiple sources, and we need to combine that data for further analysis. In such instances, join and merge operations are required.
DataFrame.join() function is used to join one DataFrame with another DataFrame as df1.join(df2)
Example
In the below example, we joined two different DataFrames to create a new resultant DataFrame.
Output
 DataFrame1:
   Name  Age
 0  Joe   20
 1  Nat   21

DataFrame2:
    Marks
 0   85.1
 1   77.8

Joined DataFrames:
   Name  Age  Marks
 0  Joe   20   85.1
 1  Nat   21   77.8
DataFrame GroupBy
GroupBy operation means splitting the data and then combining them based on some condition. Large data can be divided into logical groups to analyze it.
DataFrame.groupby() function groups the DataFrame row-wise or column-wise based on the condition.
Example
If we want to analyze each class’s average marks, we need to combine the student data based on the ‘Class’ column and calculate its average using df.groupby(col_label).mean() as shown in the below example.
Output:
Before grouping:
    Name Class  Marks
0    Joe     A  85.10
1    Nat     B  77.80
2  Harry     A  91.54

After grouping:
       Marks
Class
A      88.32
B      77.8
DataFrame Iteration
DataFrame iteration means visiting each element in the DataFrame one by one. While analyzing a DataFrame, we may need to iterate over each row of the DataFrame.
There are multiple ways to iterate a DataFrame. We will see the function DataFrame.iterrows(), which can loop a DataFrame row-wise. It returns the index and row of the DataFrame in each iteration of the for a loop.
Output
0
Name      Joe
Age       20
Marks     85
Name: 0, dtype: object

1
Name      Nat
Age       21
Marks     77
Name: 1, dtype: object
DataFrame Sorting
Data Analyst always needs to perform different operations on the underlying data like merge, sort, concatenate, etc. The most frequently used operation is the sorting of data. Sorted data becomes easy to analyze and inferred.
The DataFrame.sort_values() function is used to sort the DataFrame using one or more columns in ascending (default) or descending order.
Example
In the below example, we sort the student data based on the ‘Marks‘.
Output
Before sorting:
    Name  Age  Marks
0    Joe   20  85.10
1    Nat   21  77.80
2  Harry   19  91.54

After sorting:
    Name  Age  Marks
1    Nat   21  77.80
0    Joe   20  85.10
2  Harry   19  91.54
DataFrame conversion
After all the processing on DataFrame, we will get the expected data in the DataFrame. But, we may require to convert the DataFrame back to its original formats like CSV file or dict, or we may need to convert it to another format for further action like storing it into the Database as SQL table format.
Pandas have provided plenty of functions to convert the DataFrames into many different formats.
For example, DataFrame.to_dict() function is used to converts the DataFrame into a Python dictionary object.
Below is the example of a DataFrame which we need to convert into the Python dict.
    Name Class  Marks
0    Joe     A  85.10
1    Nat     B  77.80
2  Harry     A  91.54Code language: Python (python)
Let’s see how we can use DataFrame.to_dict() function to convert the DataFrame into the Python dictionary. By default, it creates the dictionary with keys as column labels and values as mapping of the row index and data.
Example
Output
{'Name': {0: 'Joe', 1: 'Nat', 2: 'Harry'}, 'Class': {0: 'A', 1: 'B', 2: 'A'}, 'Marks': {0: 85.1, 1: 77.8, 2: 91.54}}
Next Steps
Solve pandas exercise
- Create Pandas DataFrame from Python dictionary
- Create Pandas DataFrame from Python List
- Drop columns in pandas DataFrame
- Drop duplicates in pandas DataFrame
- Drop columns with NA in pandas DataFrame
- Rename columns in Pandas DataFrame
- Convert Pandas DataFrame to Python dictionary
Reference: pandas DataFrame documentation